MAPS and CHARTS Pre-Lab
Exercise
This pre-lab will orient you to
some of the skills needed to successfully read and interpret maps and nautical
charts, and to answer the pre-lab
questions.
The exercise has four sections:
1. Map
projections
2. Map locations
(latitude – longitude system)
3. Map
scales
4. Contour
lines
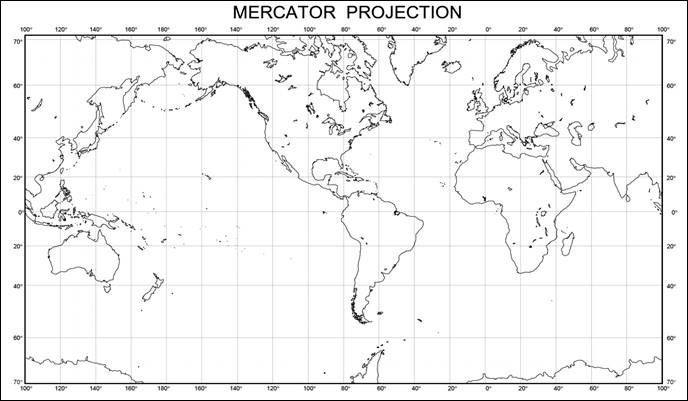
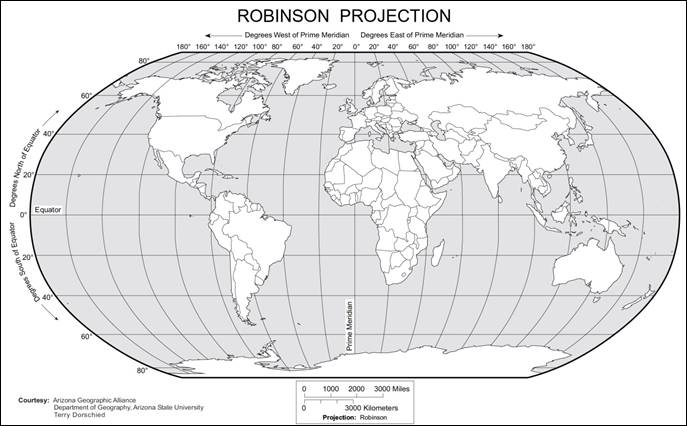
Map Projections
All maps and nautical charts
produce some degree of distortion when transferring the Earth's
spherical surface to a flat piece of paper or computer screen. The
ways that we deal with this distortion give us various types of map
projections. Depending on the type
of projection used, there may be distortion of distance, direction, shape
and/or area. One type of projection may
distort distances but correctly maintain directions, whereas another type may
distort shape but maintain correct area. The type of information we need from a
map determines which type of projection we might use. Below are two common projections among the
many that exist: the Mercator Projection and the Robinson
Projection. In oceanography lab, you
will most often use maps based on the Mercator
Projection.
Map Locations
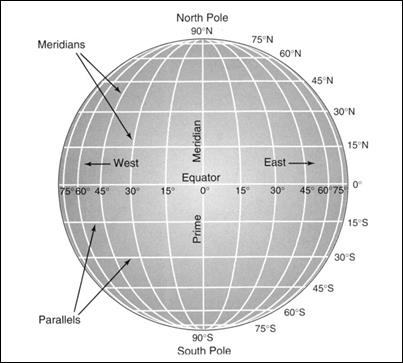 The latitude-longitude system is the
standard that we use to locate places on the Earth’s surface. It uses a grid of intersecting east-west
(latitude) and north-south (longitude) lines.
Any point on Earth can be identified by the intersection of a line of
latitude and a line of longitude.
The latitude-longitude system is the
standard that we use to locate places on the Earth’s surface. It uses a grid of intersecting east-west
(latitude) and north-south (longitude) lines.
Any point on Earth can be identified by the intersection of a line of
latitude and a line of longitude.
Lines of
latitude:
·
also called “parallels”
·
equator = 0° latitude
·
increase N and S of the equator
·
range 0° to 90°N or 90°S
Lines of
longitude:
·
also called “meridians”
·
Prime Meridian = 0° longitude
·
increase E and W of the Prime Meridian
·
range 0° to 180° E or W
Figure
from Trujillo and Thurman, Essentials of Oceanography
Lines of latitude and longitude
are given in degrees (°) because
they represent angular distances. A
single degree of latitude covers 60 nautical miles, which is about 69
statute miles (the miles that we use on land).
Since one degree of latitude or
longitude represents a large distance, we usually need more precision. To locate places more precisely, one degree
is divided into 60 minutes (indicated
by a single tick mark: for example 27‘ means 27 minutes), and one minute is divided into 60 seconds (indicated by a double tick
mark: for example 52“ means 52
seconds). (Note that these are not
minutes and seconds of time, but small angular distances.)
A nautical mile, by
definition, is the distance represented by one minute of latitude, and it
equals about 1.15 statute miles, or 6076 feet. In oceanography lab, you will usually be
required to locate places to the nearest minute (nearest nautical mile) on most
of the nautical charts you will use.
When writing a location, latitude is listed first and longitude
second. The latitude value is
followed by either N (north) or S (south) to indicate whether the location
is north or south of the equator. The longitude value followed by either E
(east) or W (west) to indicate whether the location is east of west of the
Prime Meridian.
Examples:
Oceanside
Harbor is located at: 33°12’N,
117°24’W. Verbally, you would
say that the harbor is located at “33 degrees 12 minutes north, 117 degrees 24
minutes west.”
Moscow,
Russia is located at: 55°45’N,
37°38’E Verbally you would say, “55
degrees 45 minutes north, 37 degrees 38 minutes east.”
Ayers
Rock, Australia is located at: 25°21’S, 131°2’E
Verbally you would say “25 degrees 21 minutes south, 131 degrees 2
minutes east.”
Map Scales
A scale allows us to translate the distance on a map or chart to the
true distance across the Earth’s surface.
You’re probably familiar with the bar
scales shown on many road maps. In
oceanography, a useful bar scale comes
from the fact that one nautical mile is equal to one minute of latitude. Therefore, you can use the black-and-white
latitude minute bars on the edges of a nautical chart to figure out distances
in nautical miles.
Another form of map scale is the ratio scale, which relates map distance
to true distance as a ratio, written, for example, as 1:24,000 or 1:100,000. For instance, if the ratio scale of a map is 1:100,000, this means that one inch
measured on the map equals 100,000 inches in actual distance, or one centimeter
on the map equals 100,000 centimeters actual distance, etc.
Steps for
calculating true distances from map distances using the ratio scale:
Here is an example of how to convert a distance in inches on a nautical
chart to a true distance in nautical miles:
·
You measure with a ruler on your map and find the
distance between two points is equal to 9.5 inches.
·
The ratio scale of the chart is 1:100,000,
which tells you that one inch on the chart equals 100,000 inches true distance.
·
Multiple 9.5 inches x 100,000 = 950,000 inches. This is the actual distance between the two
points in inches.
·
Divide 950,000 inches by 12 inches per foot =
79,167 feet. This is the actual distance
between the two points in feet.
·
Divide 79,167 feet by 6076 feet per nautical mile =
13.03 nautical miles
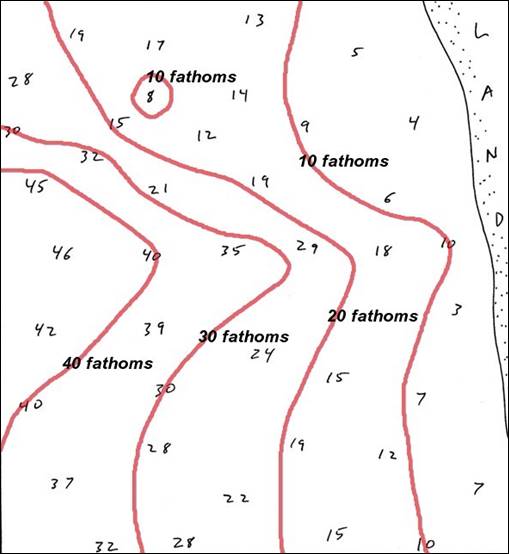
Contour Lines
Elevations on land maps, and ocean
depths on nautical charts, are indicated by contour lines. A contour line is a line drawn on a
map or chart through all points having equal elevation or depth. Successive contour lines have units of
separation called contour intervals. Contour intervals are always consistent
round-number values. For example, on a
chart with a 50-fathom contour interval, the contour lines will be
labeled 50 fathoms, 100 fathoms, 150 fathoms, 200 fathoms, and so forth.
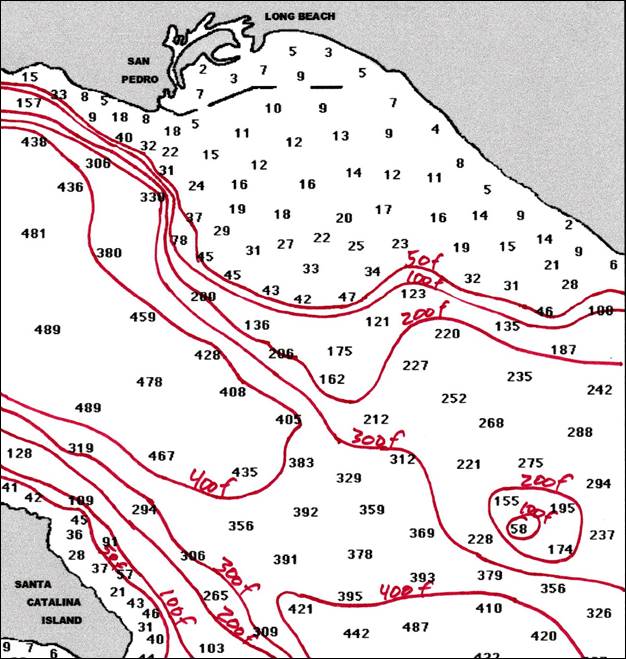
Below is an example of a contour map of the ocean floor between
Long Beach and San Clemente Island. The
soundings (depth measurements made by a ship at specific locations) are in fathoms (1 fathom = 6 feet). Notice that each contour line is a labeled
with a round number (100f, 200f, etc.) indicating the depth of that contour
line in fathoms. If you could walk along
the ocean floor following any of those red lines, you would always be at the
same depth.
Contour lines have the following
characteristics:
1. Contour lines cannot join,
split, or cross one another. Since a
contour line connects areas that all have the same elevation or depth, if two
separate contour lines join, split, or cross, it would mean that a single place
has two different elevations or depths, which is impossible.
2. Closely spaced contour lines
represent steep slopes; widely spaced lines represent gentle slopes.
3. There are only two ways that a
contour line can end on a map; it can either run into the edge of the map, or
it can close back on itself to make a loop.
4. Where contour lines cross a
valley they form a “V” shape where the point of the “V” points up the valley.
Contour maps that show depths
below sea level are called bathymetric
maps. (Bathymetry = the measurement of ocean depths.) In constructing bathymetric maps, first
depths of water are determined by soundings—depth
readings taken at specific places from a ship, usually by echo-sounding (pulses
of sound that travel to the bottom and bounce back up to the ship). The depth soundings are plotted on a map, and
contour lines are then drawn through and around these values to connect all
points of equal depth.
The number one most helpful rule
when you are drawing a contour map is this: Whatever value you are contouring, thread your contour line between
soundings that are less than that value on one side, and greater than that
value on the other.
Here
is an example below. The hand-written
numbers on the map represent soundings in fathoms at each location. (1 fathom = 6 feet.) Notice that the contour lines always go
between soundings that are higher on one side of the line and lower on the
other side. For example, you can see
that the 10-fathom contour line has numbers less than 10 on one side, and
greater than 10 on the other side. Where
a sounding happens to equal 10 fathoms, the 10-fathom contour line goes right
through it. The same rules apply to the 20-, 30-, and 40-fathom contour
lines.