Wave dispersion illustrated by a
large North Pacific storm: November 2-3, 2010
(data from
Surfline and the Coastal Data Information Program)
Wave
height: the vertical
distance from the trough (low point) to the crest (high point) of a wave, measured
in feet or meters.
Wavelength: the horizontal distance between two
successive wave crests, measured in feet or meters.
Wave
period: the time
between two successive wave crests, measured in seconds.
On about
November 1, 2010, an intense storm system developed over the Gulf of Alaska,
whipping up huge waves. The waves began
to spread away from the storm, and as the waves traveled south, gigantic surf
soon began to hit the coasts of Canada, Washington, Oregon, and
California. The waves had a range of
wavelengths and wave periods, and thus dispersed from the storm area at
different speeds.
Image 1 below shows the expected wave
heights from this storm on November 2.
The color scale at the bottom shows the heights of the waves in
feet.
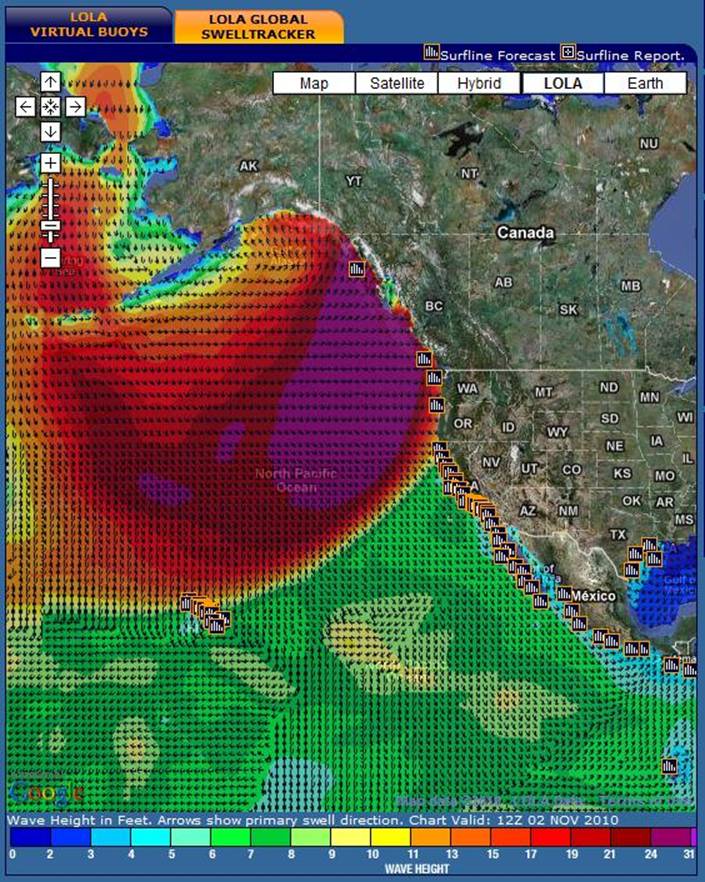
Image 2 below shows the expected wave
periods from this storm on November 2.
The color scale at the bottom shows the wave periods in seconds.
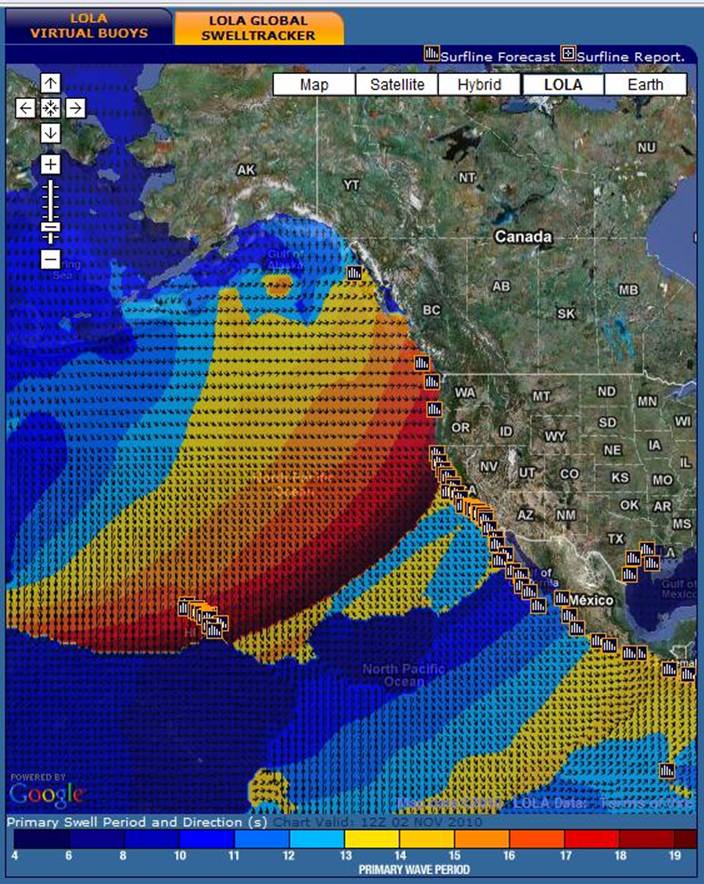
Image 3 below shows some of the early waves
from the storm arriving along the coast of southern California. The time is 12:36pm
on November 2. A sensor buoy—the
CDIP Harvest Buoy off of Point Conception—detected the waves. The buoy recorded the height in feet
(Hs(ft)), the period in seconds (Tp(s)), and the compass direction
(Dp) of the waves. (The waves of interest
here are the North Pacific swells, the first row of numbers under where it says
“Deep Water Swell.” You can ignore the
much smaller South Pacific swells shown in the second row of numbers.) Notice the very large waves hitting the coast
north of Point Conception (the scale bar gives the expected wave heights). Notice how the waves along the coast south
and east of Point Conception are much smaller.
This is because of the change in the direction of the southern
California coastline sheltered the coast from the full fury of these waves as
they approached from the northwest.
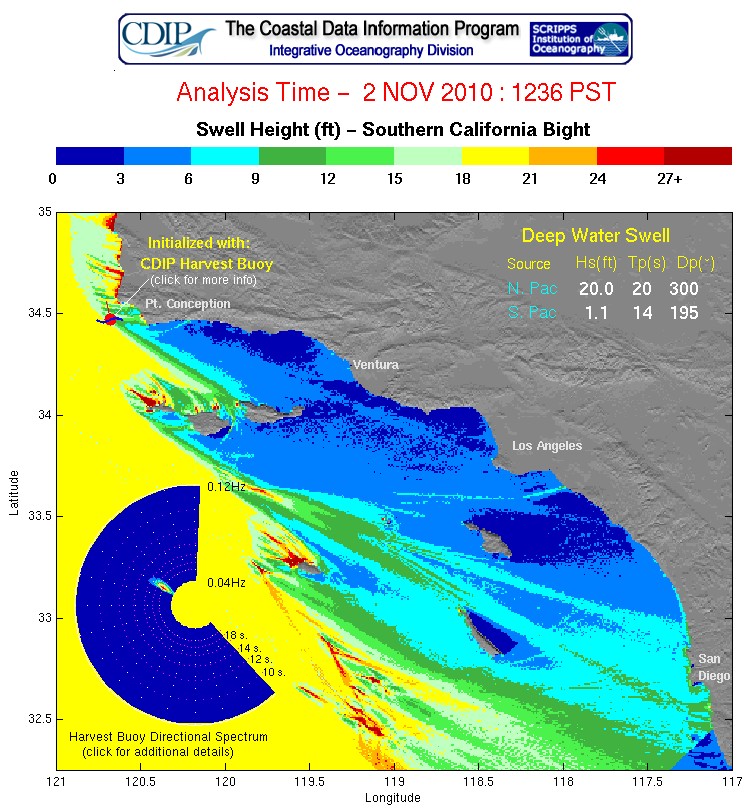
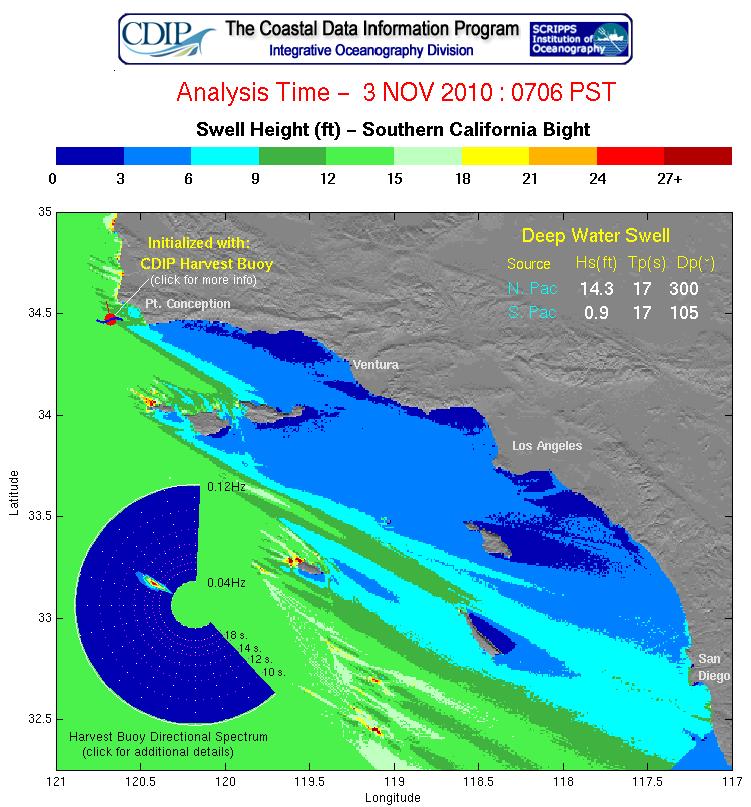
Image 4 below shows the storm waves at 7:06am
on November 3: about 18 hours later than Image 3
above. You can see, in the numbers under
“Deep Water Swell,” that the compass direction (Dp) of the waves has not
changed; the waves are still coming in from the northwest. But notice that both the wave height and the
wave period have changed. These are all
waves from the same storm, but they arrived in southern California at different
times.
USE THE INFORMATION IN
THE TEXT AND IMAGES ABOVE TO ANSWER THE QUESTIONS FOR THE ASSIGNMENT.