Experiment 9
Atomic Emission Spectroscopy - Determination of Rydberg Constant
In this experiment, you will determine the Rydberg constant using the line spectrum for hydrogen. Because the spectroscopes may lose their calibration, you will actually perform a calibration step, to correlate the experimental readings with the actual wavelengths for your experiment. You will use a Hg discharge lamp to perform this calibration. Once you have a calibration curve (actually a straight line), you will use the formula for this line to adjust your experimentally determined wavelengths to give a more accurate set of wavelengths. For example, if you had a scale that always read 10 pounds light, while you might feel good because you don't weight as much, your weight is not accurate. Therefore, the weights you measure on your scale need to be adjusted by 10 pounds to give the correct values. This calibration curve allows you to adjust your measured values to the more correct values.
The actual Rydberg constant R (Rydberg constant) is 3.28984 x 10¹⁵ s-1. The value of RH that we used in the text, and are instructed to calculate in this experiment, is equal to about 2.178 x 10⁻¹⁸ J. This RH represents the product of Planck's constant (h) which is 6.626x10⁻³⁴ J·s, and the actual Rydberg constant (3.28984 x 10¹⁵ s-1). Do the calculation yourself to verify this value. The RH value described above actually has energy units (Joule), which are apparent from the equation we used in class: ΔE=hν. The value for n, and the way n is calculated, is shown below (this formula includes the real Rydberg constant).
For the above equation, n is frequency (s-1), R is the real Rydberg constant, nlo is the final energy level (nf), nhi is the initial energy level (ni). (Remember that we used the designations of nf and ni in lecture for the final energy level and initial energy levels.) The above equation is convenient to use, instead of the following equation, when you want to determine the wavelength of light of a particular transition (such as the transition of an electron from energy level 5 to 2 [hydrogen blue light]).
To determine the wavelength (λ) for an electron transition in hydrogen, simply rearrange the equation c=λν to yield λ=c/ν, since n is a function of the Rydberg constant (R), and the first energy level equation shown above. You do not need to calculate energy (ΔE), in order to calculate the wavelength, by rearranging the equation ΔE=hν=hc/λ, which would be required, if you first calculated the energy of the transition. It is simple, and straightforward to use the equation using the real Rydberg constant, the modified RH constant, which includes Planck's constant.
Using the Spectroscope:
The scale on your spectroscope will be similar to the scale shown below. If your scale is in hundreds, as shown below, then the unit of measurement is in nanometers (nm; 10-9 m). If your scale is in thousands, instead, then the unit of measurement is in Angstroms (Å; 10-10 m). If your units are Angstroms, divide this value by 10 to get nanometers (e.g., 4500 Å becomes 450 nm). Make certain you know the units you are using.
λR=Red line wavelength (in nm; 10-9m) |
λG=Green line wavelength (in nm; 10-9m) |
λB=Blue line wavelength (in nm; 10-9m) |
λV=Violet line wavelength (in nm; 10-9m) |
ΔE=hν=hc/λ=-R(1/nf2-1/ni2) |
|
The Mercury spectrum:

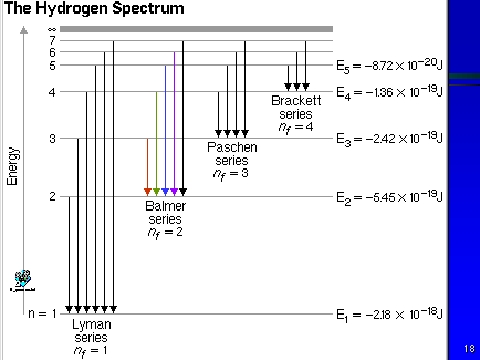
The drawing below represents the different emission spectra from the hydrogen atom. The Balmer series is the only emission series which emits the visible light spectrum. The Lyman series spectrum represent light which is UV, not being visible to the naked eye, and terminates at the n=1 energy level. The Balmer series represents transitions to the second energy (n=2) level.
Go To Experiment: 1 2
3 4
5 6
7 8
9 10
11 12
Return to Chem110 Experiments Index